
It’s been a very active hurricane season with some incredible storms reaching levels rarely seen in the Atlantic ocean. From Houston to the Keys in Florida to Barbuda and San Juan, Puerto Rico, there’s been a lot of damage from tropical systems this year. It’s only natural to ask what’s going on with the weather and why this year has been so active with so much destruction.
Hurricane Maria reached Category 5 strength this week. NOAA-GOES 16
Good science demands we ask good questions. One thing we should be asking is how much influence man-made factors might be having on the number of hurricanes, their strength and even the track of these storms. Another factor is the role of natural fluctuations in the global climate, such as El Nino, La Nina, this decade. (If you’re reading with preconceived ideas it may be difficult to see beyond your own ideological view.)
The reality of most issues is often found somewhere in the middle of two different thoughts. When it comes to the role humans play with our weather and climate, the truth likely lies straddled between the ideas that humans are causing all these big storms and the idea that nature is just being nature and these things would occur regardless of whether we drive SUV’s or not.
EARTH’S NATURAL CYCLES ARE AN IMPORTANT PLAYER
Natural variability plays an enormous role in each hurricane season. Whether or not there is an El Nino, things like the amount of dust and dry air coming off sub-Saharan Africa, whether the Atlantic is in it’s warm or cold phase and the relative strength of the Bermuda high all influence the number of tropical systems that occur each season. This is why this year’s hurricane season was accurately predicted to be average long before it began.
An article this past April in The Journal of Geophysical Research looked at many of the natural variables and how much influence they have on each hurricane season. These factors can change monthly, yearly or even over decades. The chart below shows many of these different variables in each square: red is indicative of a positive often warm phase, blue a negative, often cooler phase. Depending on the phase of the particular variable, it can either help bring about a more active hurricane season or a less active one. If you have several variables all favoring more tropical activity, such as this year, we see very active seasons. The opposite has been true as recently as 2014 when there were only 8 named storms.
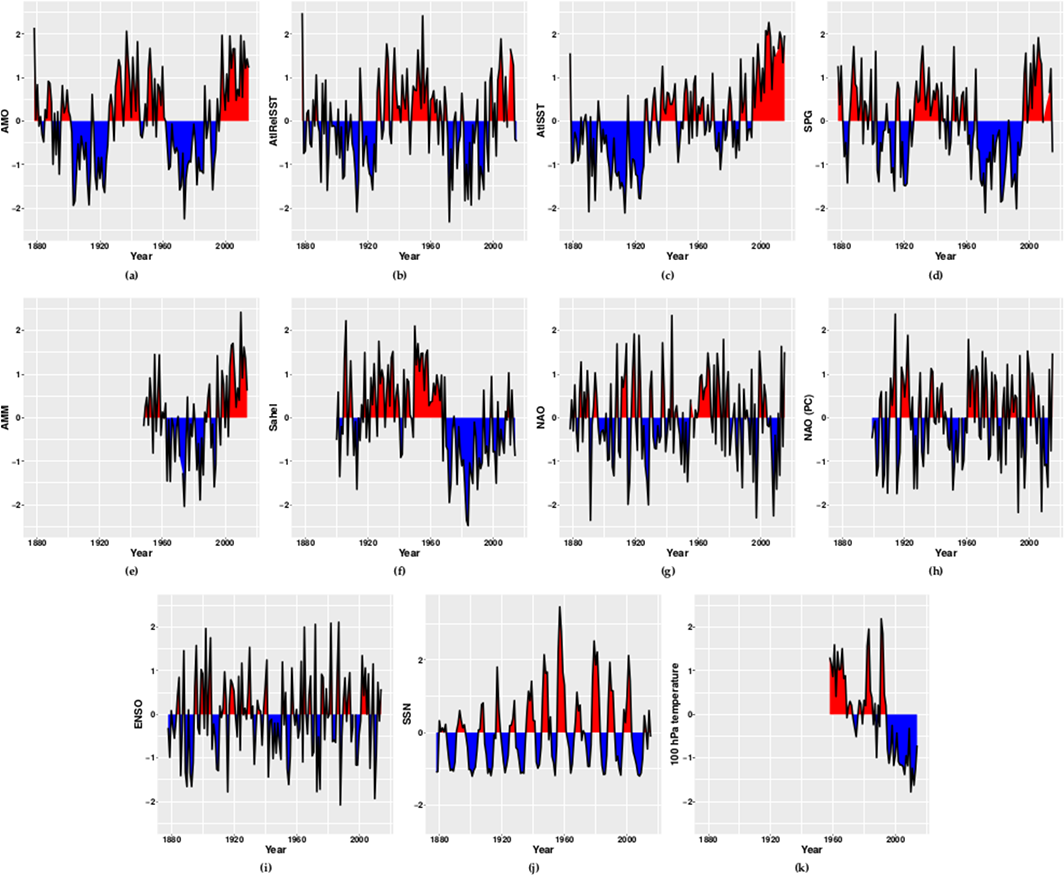
Standardized time series of various climate indices used in this study: (a) AMO, (b) Atlantic relative SST, (c) Atlantic SST, (d) subpolar gyre temperature, (e) AMM, (f) Sahel rainfall, (g) standard NAO, (h) mobile NAO, (i) SST anomaly over the Nino3.4 region, (j) SSNs, and (k) 100 hPa temperature over the MDR. Journal of Geophysical Research: Atmospheres Volume 122, Issue 8, pages 4258-4280, 25 APR 2017 DOI: 10.1002/2016JD026103
HUMAN INFLUENCES CANNOT BE DISCOUNTED
Of course human influence on the climate is widely accepted and some of the warming we have observed over the past 100 years is due to man’s influence. It’s naive to think anthropogenic warming has no influence on the planet or its weather patterns.
In the journal Climate Dynamics back in 2014, researchers looked at the number of Category 4 and 5 hurricanes with regard to observed warming trends. The researchers from the National Center for Atmospheric Research concluded the number of hurricanes wasn’t changing, but those that did occur were more likely to be in the stronger category than a few decades ago.
Relationship of annual Cat 4–5 proportions to annual variations in tropical SST anomalies relative to the 1975–2010 mean: a global proportions, b western North Pacific proportions. The data are binned into 0.1 °C intervals from which average, maximum, and minimum proportions are derived. Holland, G. & Bruyère, C.L. Clim Dyn (2014) 42: 617. https://doi.org/10.1007/s00382-013-1713-0
NOT MORE STORMS, BIGGER ONES
Last year, Nam-Young Kang and James B. Elsner wrote about a tradeoff between intensity and frequency of global tropical cyclones. Their paper, like the NCAR research above, found no significant increase in the overall number of storms in the past century, but the storms which did occur were more likely to be in the stronger category.
NOAA data is similar, but does show an increase in short-lived smaller storms. For those that argue there are more storms now, remember that satellites were not used to see these storms prior to 1960 and we are now naming tropical storms that would not have gotten a name 50 years ago.
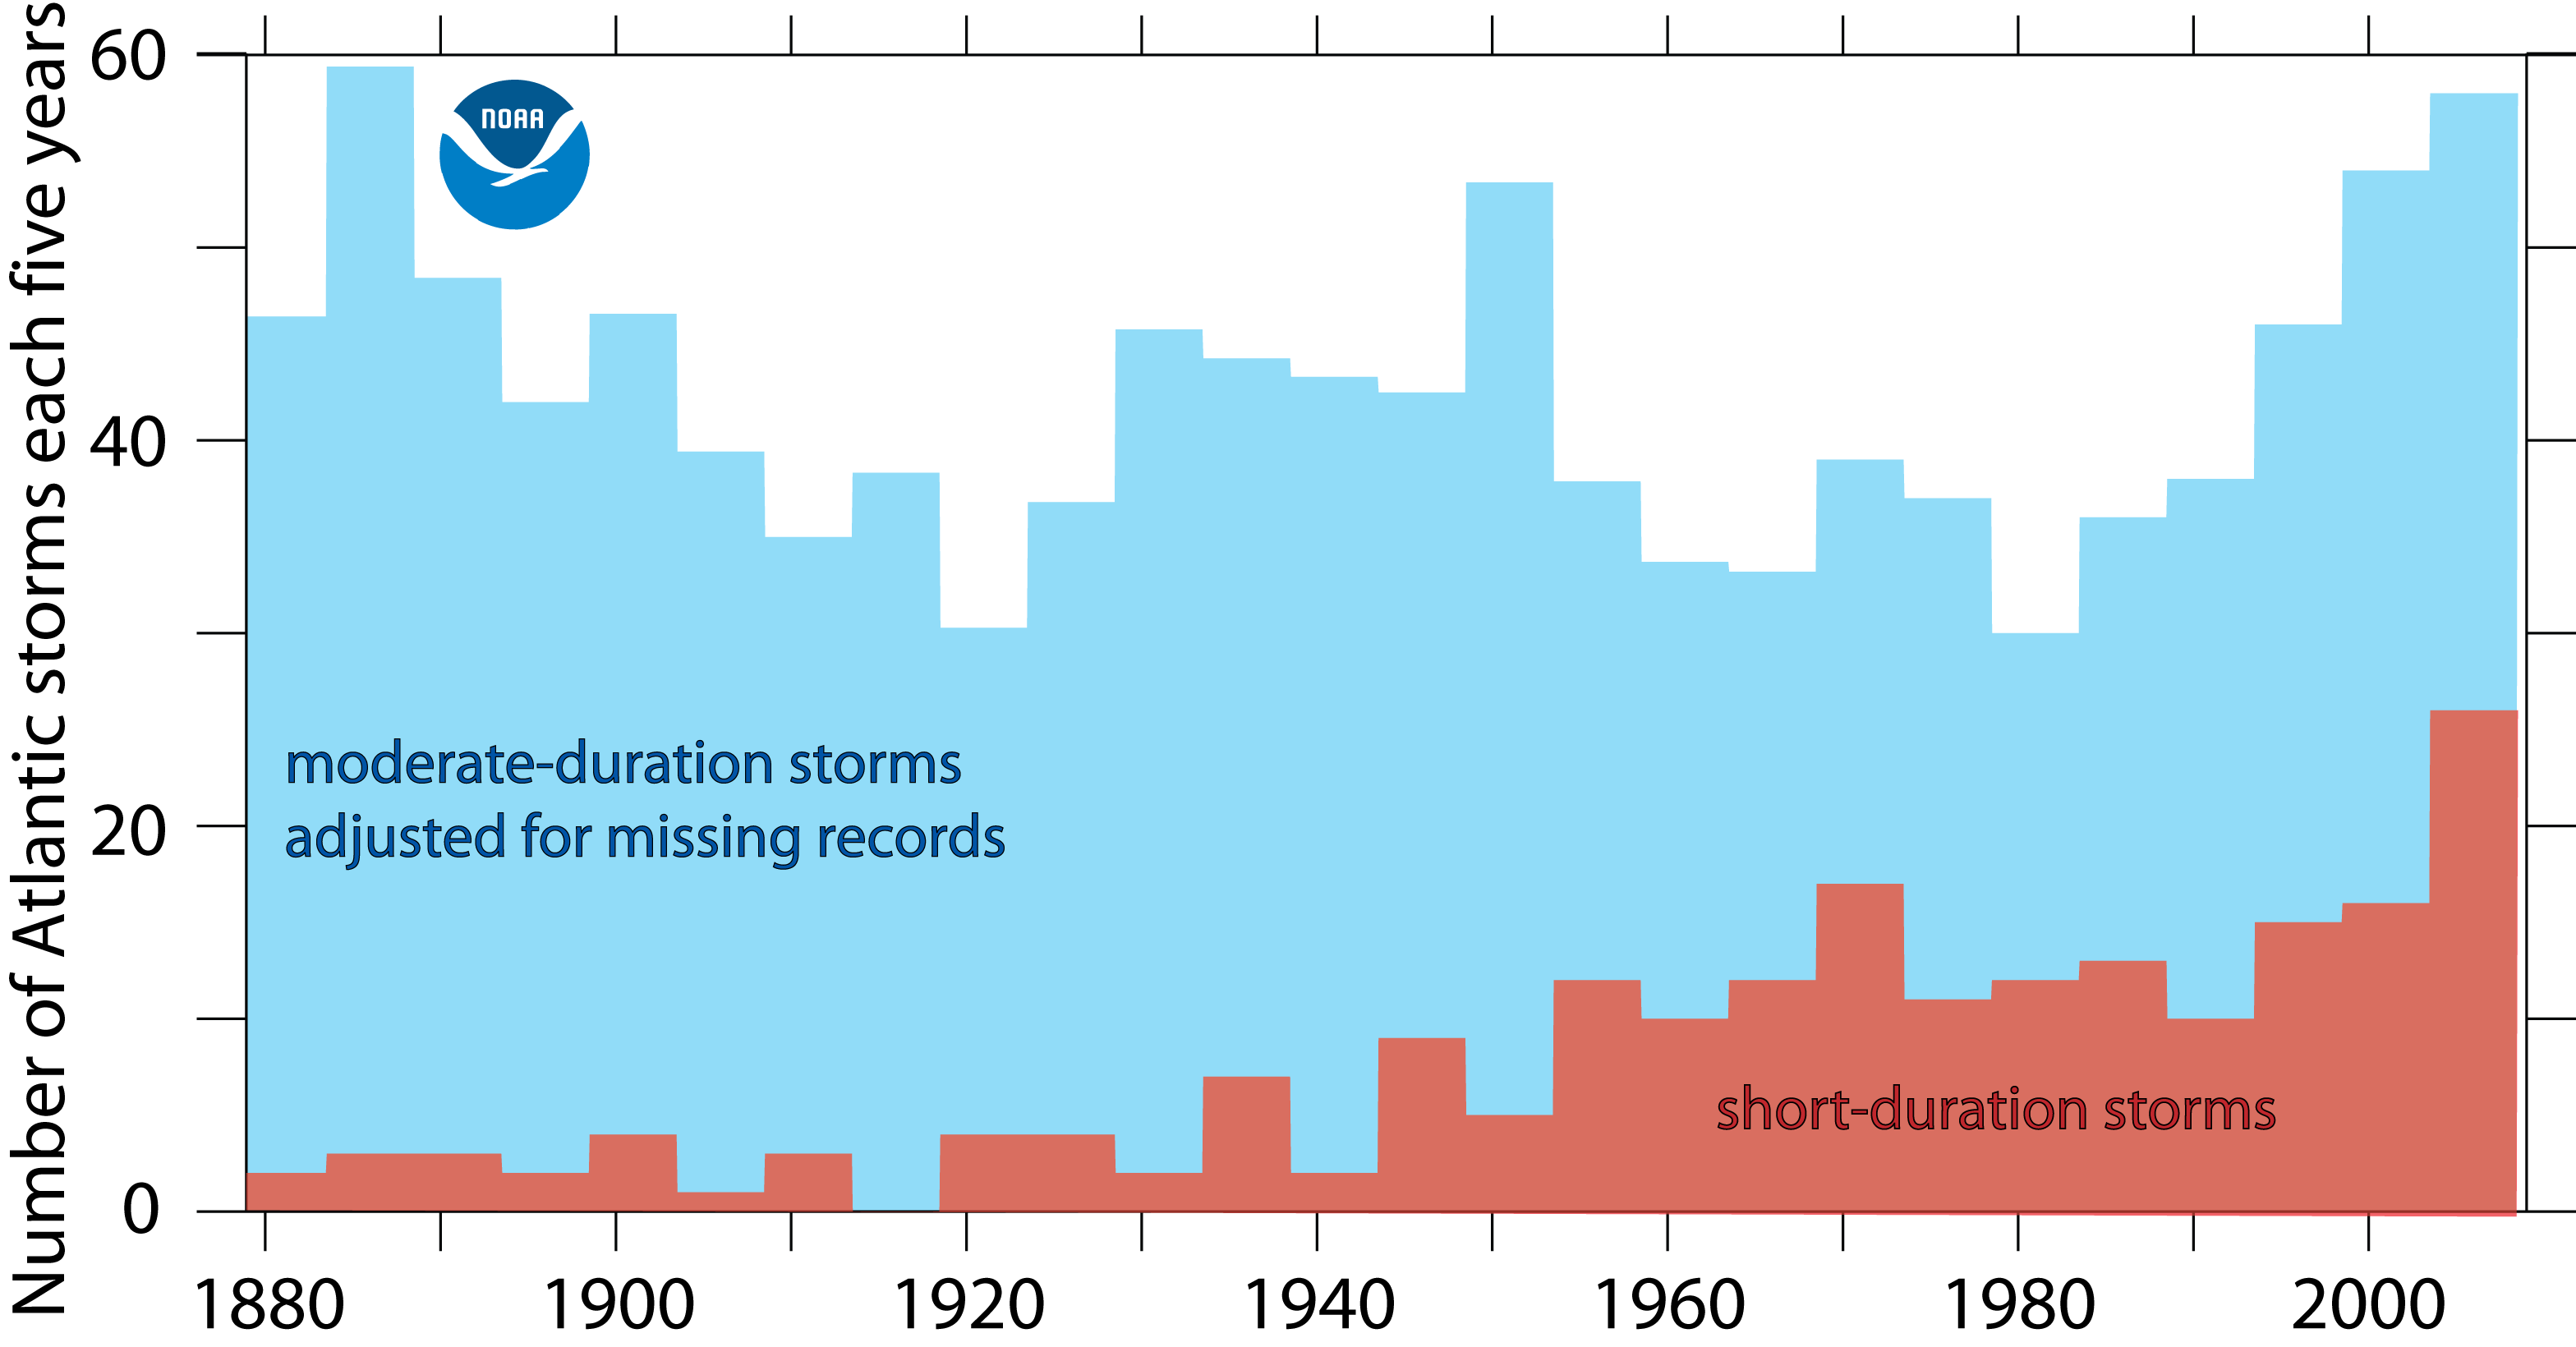
Atlantic tropical storms lasting more than 2 days have not increased in number. Storms lasting less than two days have increased sharply, but this is likely due to better observations. Figure adapted from Landsea, Vecchi, Bengtsson and Knutson (2009, J. Climate)
WHAT DOES IT MEAN?
We can make some conclusions from this research. First, we are not seeing a new normal in terms of the frequency of hurricanes. This year’s higher than average activity is primarily due to cyclical climate factors, not a warmer ocean. However, the fact that some of these storms reached such intense levels may be attributed to the warming oceans over the past century. While the trend line for the number of storms remains essentially flat, (we will have active and inactive years in the future) those storms which do occur appear to be getting stronger. This has important ramifications for how individuals, local government and even FEMA all prepare for these storms.
Whether a hurricane hits a populated area is somewhat due to just bad luck, but when they do hit, it appears the odds of a particular storm bringing stronger winds, higher storm surges and more rain may be something we need to get used to.
Follow Dave Epstein on Twitter @growingwisdom
Comments are no longer available on this story